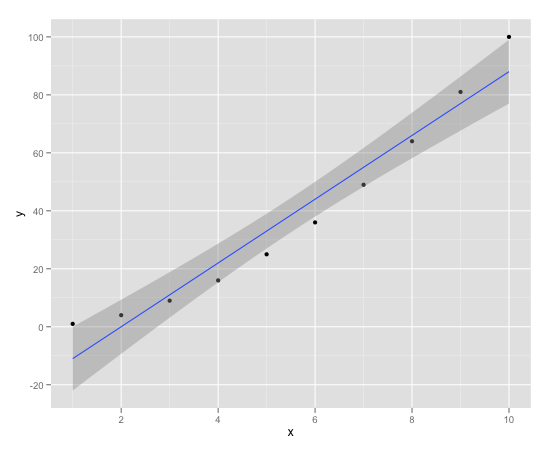
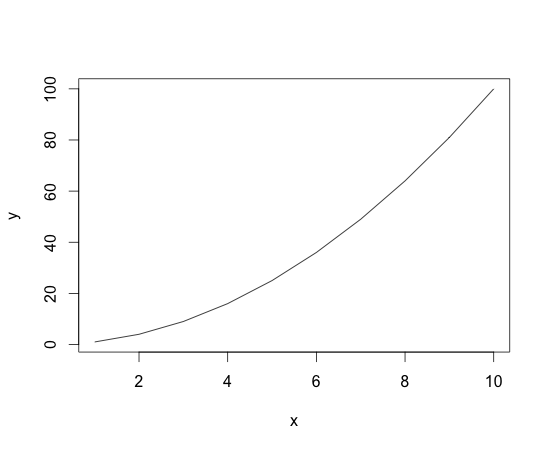
> c
x y
1 1 1
2 2 4
3 3 9
4 4 16
5 5 25
6 6 36
7 7 49
8 8 64
9 9 81
10 10 100
> summary(fitted.regression)
Call:
lm(formula = y ~ x)
Residuals:
Min 1Q Median 3Q Max
-8 -6 -2 4 12
Coefficients:
Estimate Std. Error t value Pr(>|t|)
(Intercept) -22.0000 5.5498 -3.964 0.00415 ** # Kasutades Coefficients Estimate -22.0000 + 11.0000 * x saame antud mudeli (fitted.regression) põhjal ennustatava y väärtuse. Vabaliige -22.0000 kui x on 0 siis y = -22.0000
x 11.0000 0.8944 12.298 1.78e-06 *** # Estimate/Std. Error=t value (11.0000/0.8944=12.29875 – standard errors away from zero) Kui t value on suurem kui 3, siis on väga suur tõenäosus, et x on seotud y-ga.
—
Signif. codes: 0 ‘***’ 0.001 ‘**’ 0.01 ‘*’ 0.05 ‘.’ 0.1 ‘ ’ 1
Residual standard error: 8.124 on 8 degrees of freedom # Residual standard error: 8.124 = sqrt(mean(residuals(fitted.regression) ^ 2)) – kuigi antud juhul saan mina 7.266361
Multiple R-squared: 0.9498, Adjusted R-squared: 0.9435 # Multiple R-squared: 0.9498 kui suurt osa x-st kasutati andmetest meie mudeli koostamisel. 0.9498 -> 94% on väga hea
F-statistic: 151.3 on 1 and 8 DF, p-value: 1.778e-06
> -22.0000 + 11.0000 * 1
[1] -11
> -22.0000 + 11.0000 * 2
[1] 0
> -22.0000 + 11.0000 * 3
[1] 11
> -22.0000 + 11.0000 * 4
[1] 22
> -22.0000 + 11.0000 * 5
[1] 33
> -22.0000 + 11.0000 * 6
[1] 44
> -22.0000 + 11.0000 * 7
[1] 55
> -22.0000 + 11.0000 * 8
[1] 66
> -22.0000 + 11.0000 * 9
[1] 77
> -22.0000 + 11.0000 * 20
[1] 198
> -22.0000 + 11.0000 * 100
[1] 1078

